Hola! Bonjour! As-salam alaykom! Hello!
 It’s been a busy four months since I went into woodshed mode to help create the Ecocitizen World Map Project, a portal where citizens can map their communities and share first-hand information for a holistic assessment of their city’s ecological and social health. The one thing I’ve probably missed the most while wading through oodles of HTML, CSS, and GIS has been some good old fashioned ruminating from the spaces between soil and soul. So, I’m taking this opportunity to yak it up about the project and share a few stories and visuals of Medellín, Colombia, one of our initial three pilot cities. (with Casablanca and Cairo completing the awesome triad!)
Speaking of Medellín, we’ll be officially launching this groovy tool for sustainable urban development that links community crowdsourced information to national, regional, and global data sets at the upcoming 7th World Urban Forum from April 5-11th.
More about that a bit further on, but as anyone who’s ever been deeply immersed in a multifaceted project can attest to, the danger of making sense only to yourself while sounding like a babbling cryptogram to everyone except the people you’re working with increases proportionally with each additional hour you spend with your head buried in jargon and code. So at the risk of being a bit long-winded but in the hopes of reclaiming my ability to some day carry a normal conversation at a social gathering again, I will use this opportunity to pretend we’re sitting at a pub and you’re asking about that crumpled map sticking out of my pocket.
As my favorite author once launched into a story: “All this happened, more or less.”
The Idea Behind the Map

 We all know by now that if we want to keep living on this planet we have to stop acting like we have one and a half, or in the American case, five of them. We also know that cities are responsible for emitting 70% of the world’s greenhouse gases while occupying only 2% of the planet’s land cover, and that by 2050, 70% of all people on the planet are expected to live in an urbanized area. It follows that if we designed the world’s cities so that people could go about their lives without overdrafting our collective ecological bank account we’d be well on our way towards a sustainable human modus operandi.
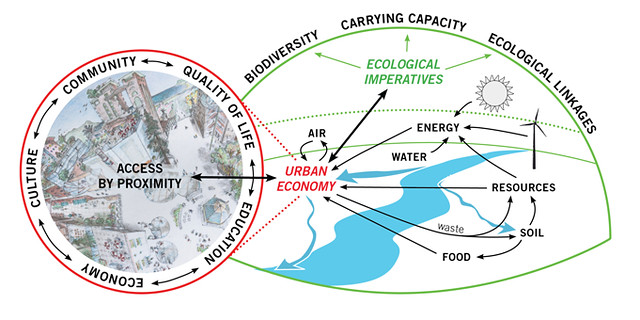
How we get there is a much more difficult question. Cities aren’t linear, one-dimensional entities that can simply be rebooted or traded in, but complex bio-geo-socio-cultural organisms functioning within even larger organisms, not unlike our bodies. While it’s tempting to just give them an eco facelift, adding a bike lane here and an energy-efficient building there and calling it “green” is a bit like getting your hair done when you’re trying to prevent heart disease. You’ll look better and perhaps it’ll even lift your spirit for the day, but if the objective is to be fundamentally healthy you’d be well-advised to pay attention to a whole range of factors, from diet, exercise, and getting enough sleep to family history, your region’s soil condition, and your level of happiness.

This type of holistic approach to urban health has been the centerpiece of the ecocity concept. First conceived by Richard Register over 25 years ago and since developed by the organization he founded (that I’ve been fortunate to be part of in various capacities for the last decade or so), Ecocity Builders, the key challenge in recent years has become this: how do we turn this great idea that more and more people are beginning to understand and endorse into a meaningful metric that cities and individuals can go by to see where they’re making progress and where their biggest challenges lie?
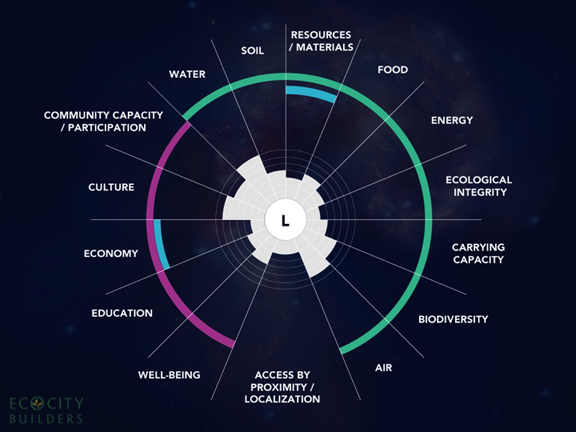
This question has led us over the past four years to develop the International Ecocity Framework and Standards (IEFS), a methodology that enables cities to assess their ecological health along these 15 conditions, helping to guide progress for each urban organism to become more restorative by nature.
The visual interpretation of a city as an organism within larger organisms looks something like this…
There is, of course, a lot of tangible, empirical data each city has available to see where it falls in some of the 15 ecocity conditions, especially physical ones like clean air, energy use, or water quality. In fact, there are meta diagrams that can illustrate the resource/materials dimension of a city in simple and standard ways, tracking all that goes in, all that comes out on the other end, and what happens in between, which is what you need in order to assess a city’s overall energy efficiency and ecological footprint. In fact, one of the preeminent experts on these meta flow charts and an associate for the IEFS, Sebastian Moffatt, specializes in measuring the urban metabolism through visualization tools like the Sankey diagram.
For example, here is a meta diagram of the current energy system of Jinze, Shanghai on the left, and a scenario for an advanced system on the right that Sebastian produced for a project called Eco2 cities:
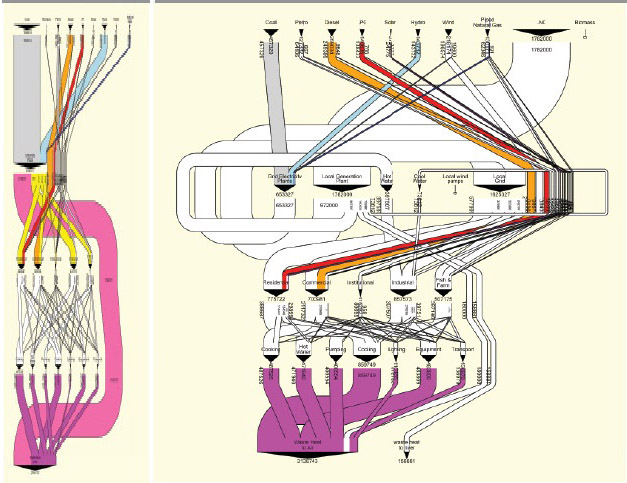
The meta diagram on the right provides a scenario for an advanced system that helps reduce emissions and costs and increase local jobs and energy security. For example, a local electricity generation facility is powered by liquified natural gas and provides a majority of the electricity needs and hot and cool water for industry (cascading).
Source: Author elaboration (Sebastian Moffatt) with approximate data provided by Professor Jinsheng Li, Tongii University, Shanghai.
But the deeper you dig, the more challenging it gets to analyze an organism as big and diverse as a city. Drawing up a grand vision and analyzing flow charts are hugely important elements, but how on Earth do you integrate and apply all that to a living breathing city in a constant state of flux, where countless different realities and perspectives intersect and evolve on a daily basis? And then compare two or more cities, to see where they overlap and where they can learn from each other?
To use the body metaphor again, it’s one thing to reset your bone when you break your arm, but what about the hundreds of conditions and imbalances, both physical and psychological, that are much more elusive and harder to track, requiring observation, context, nuance, and intuition? In other words, how do you diagnose or treat a city that might be struggling with anything from asthma, allergies, and nutrient deficiencies to migraines, ADHD, depression, and even oppression?
This is where you realize that in order to do an honest and meaningful evaluation of a city’s overall ecological health, you have to move beyond treating it like an auto body shop or a hard drive and towards treating it like… a human being! If you want to even be close to a truthful representation of an urban environment, you have to account for all those things that make it human — the history, the culture, and the politics — the experiences, perceptions, motivations, and beliefs — the personalities and the fallibilities.
And who better to provide that information than the citizens of those ecosystems — the ECOCITIZENS!

The Ecocitizen World Map Project
It became clear not too far into the deliberations and designs around the IEFS that there would have to be some sort of grassroots driver to give the initiative life and authenticity and reflect the democratic and holistic blueprint it was seeking to represent. That’s how the idea for a crowdsourced map that would complement the hard data coming from participating cities got started.
At this point I couldn’t go on without giving a huge shout-out to Kirstin Miller, Ecocity Builders’ tireless ED who pretty much single-handedly took a quiver full of the batons on both the Ecocity Standards and the Ecocitizen World Map projects and ran them across the globe, passing them off to all kinds of amazing individuals and groups who are now partnering with us on to this. People always think Ecocity Builders is this big organization with huge influence, but it’s really just Kirstin being in 50 places at the same time, with a handful of us volunteer associates who get paid occasionally when a grant comes through giving it the kind of extra heft that makes paranoid conspiracists assume we’re the ones behind the evil plan to lock people into cages (Agenda 21!).
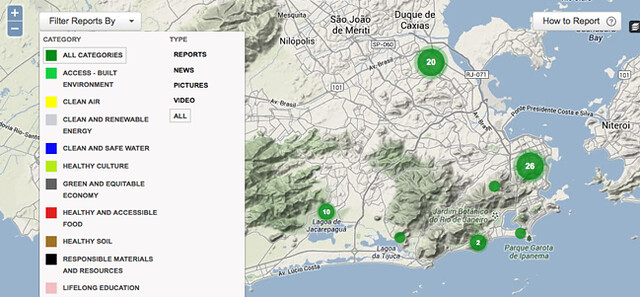
The map: We knew there needed to be both a way for anyone in the world to directly participate online by taking a survey and share individual snapshots of their neighborhoods as well as a more detailed geospatial analysis of a community’s social and environmental health that would require more sophisticated local and regional training.
The former we did not have to reinvent, as the interactive mapping and visualization platform Ushahidi that has fostered transparency and democracy across the globe was readily available. Tarik Nesh-Nash, one of our associates at Mundiapolis University in Casablanca and an experienced Ushahidi developer exposing corruption in Morocco offered his technical team to help us set up the Ecocitizen Survey along the 15 conditions as well as a simple and short survey. We’re still in the developing stages of this and eventually people will be able to upload stories and multimedia about their cities and neighborhoods, but as of this week, anyone in the world can get on the map. Go ahead, you know you want to!
For the geo-spatial aspect of the project to become a reality, it was going take a bunch of players and entities to come together and pull on the same string. In order to build out a whole systems perspective with a custom view to each location, you have to be able to access data, information and maps provided by the municipal governments, utilities, and other data providers. So you need to have participating pilot cities. You also have to have ecocitizen experts who go into neighborhoods and conduct community audits, interviewing a good sampling size of residents about the conditions on the ground and their experiences of them. Then you need the technology that can overlay the personal accounts from the community audits with the physical data provided by governments. To be able to pull all that off, you’ll have to get at least some basic funding.
 And it all came together! The seed funds awarded from the Abu Dhabi Global Data Initiative (AGEDI) and the Organization of American States (OAS) have sprouted active pilots in Egypt, Morocco and Colombia. Cairo, Casablanca, and Medellín signed on as our initial pilots cities. Corresponding classes on Ecocitizenship have launched at Cairo University and Casablanca’s Mundiapolis University. One of our team members, Dave Ron, developed the curriculum for the classes and recently spent a few weeks teaching the participatory GIS elements at Mundiapolis and Cairo U.
Currently, four more Ecocity Builders team members are joining Dave and the universities for the first of the community workshops in Cairo and Casablanca, pairing up the university students with community organizations and citizens to investigate and problem solve, together, how to increase quality of life, sustainability and resilience at the scale of the neighborhood. Esri, an international supplier of Geographic Information System software, is providing the mobile GIS technology to do the field work.
Meanwhile, our third pilot city, Medellín, is getting ready to host the UN Habitat’s 7th World Urban Forum and showcase the astounding urban transformation it has gone through. While we haven’t had any community events there yet, one of our team members, Ashoka Finley, has visited with city officials several times and brought back a wealth of information that Scott Allen at Conscious Global Change helped us turn into an interactive GIS ecocitizen map with layer descriptions, as well as the really cool Esri story map tour. Our project will be showcased throughout the conference at the Esri Geospatial Pavilion, with a “Building Resilience and Equity Through Citizen Participation and Geodesign” session presented by Ecocity Builders, the Association of American Geographers (AAG), Esri, OAS, AGEDI, and the US Department of State scheduled for April 10.
I’ll close with a few urban development projects from Medellín that I’ve been spending some pretty intimate time with over the last couple of months. In my view they showcase that creating a more just, equitable and sustainable city and thus world is not just a bunch of dreamers’ wishful thinking, but if done with care and conviction, can truly bring about the change we wish to see in the world.
Pilot City Medellín

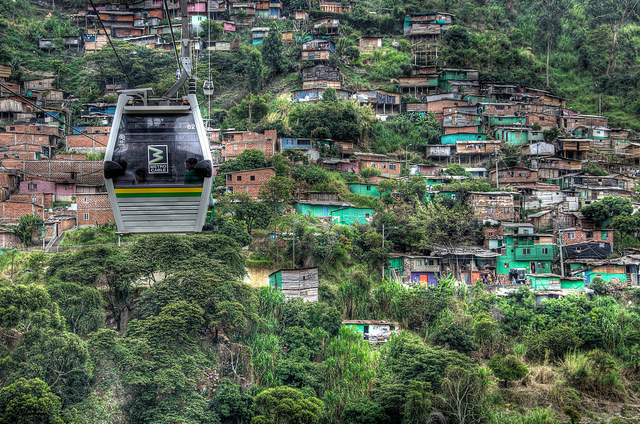
Metro Cable de Medellín by Santiago Vasquez, on Flickr/Creative Commons
Medellín, you say? Isn’t that the place run by drug kingpins, the most dangerous city on Earth? Well, you would be correct if you’d be reading this a little over a decade ago, but so much has happened since the days of the Medellín Cartel that you wouldn’t recognize your own preconception if it hit you with a dull urban master plan. In fact, the urban transformation of Medellín has been so thorough that last year the Wall Street Journal’s marketing department (in partnership with the Urban Land Institute) crowned it Innovative City of the Year, ahead of fellow finalists New York City and Tel Aviv.
Having the Wall Street Journal take a bow to Medellín is as logically puzzling as it is poetically stimulating, seeing that Medellín’s success in becoming a much nicer place to live for everyone is largely built on disproportionately investing in its poorest communities. Things like access to education, health care, and public transportation for all. Redistributing resources towards the most disadvantaged. Building social and economic equity. Narrowing the gap between the haves and have-nots. You know, that socialismy type stuff that’s usually the bogeyman of free market gospel.
Let me give you a few examples of what we’re talking about here.
Probably the most well-known chapters in the transformation story are the Library Parks, a series of public libraries strategically located in some of the most disadvantaged neighborhoods in the hillside peripheries of the city that not only grant residents easy access to educational materials but are hubs for community meetings, recreational activities, and cultural services designed to strengthen existing neighborhood organizations.
This is what Parque Biblioteca España in the Santo Domingo neighborhood looks like…

Parque Biblioteca España by Sergio Fajardo Valderrama, on Flickr/Creative Commons
Combining cutting edge architecture with the recovery of public space and green areas in itself may not be so unusual, but doing it in neighborhoods that aren’t already cultural hubs is the key feature here. Imagine Los Angeles commissioning Frank Gehry to build a learning center and meeting place in Compton instead of Walt Disney Concert Hall in downtown LA. Multiply it by 10, as is the case in Medellín, injecting opportunity and civic pride into the most marginalized areas in town, and you see how huge of a difference the mere placement of architecture can make to counter the injustices of traditional urban development and municipal management.
Another amazing project is the Metrocable, a network of cable car systems that has revolutionized mobility and accessibility for people, particularly in the poorest and often most violent communities that line the valley of Medellin’s mountainous region. The six cable car lines are an integral part of the metro system of Medellin, connecting the hilly areas of Medellin with the city center. Things like going shopping, getting to school, or seeing a doctor that used to take residents all day on foot or by (unreliable) bus are now a comfortable and scenic 25 minute ride down the mountainside, including transfer to the metro for about 60 cents.

MetroCable by LensesDrilling, on Flickr/Creative Commons
The Metrocable is part of a larger innovative sustainable transport system that includes the development of bus rapid transit (called MetroPlús) and the creation of a bike-share program — new transportation elements that are integrated with existing metro and cable car systems.
Perhaps the most daring piece of environmentally and socially equitable transportation is a giant 385 meter escalator to and from the once-notorious neighborhood of Comuna Trece, allowing people to ride up and down the hill, listening to piped music, in six minutes, rather than climb the equivalent of a 28-storey building, which took half an hour.
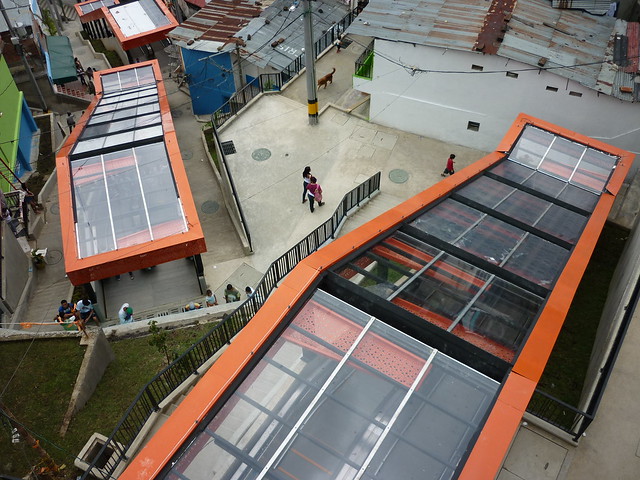
Desde arriba by Telemedellín Aquí te ves, on Flickr/Creative Commons
You can find out more about the Library Parks and Medellín Metro in these videos I put together about Education and Transportation through Mozilla’s open source Popcorn Maker. You can even remix them if you’d like to. There’s also a lot more info on our pilot page about all kinds of exciting projects the City of Medellín has embarked on to create a truly sustainable and equitable city, a place that with the help of all stakeholders is taking huge steps towards becoming more ecocity-like.
As the City’s concept paper in the lead-up to the World Urban Forum states:
Bringing urban equity into the center of development means that no one should be penalized for where they live, the way they think or believe, or the way they look.
It also means that public goods and basic services should be available to everyone, creating conditions to be distributed according to needs.
Urban equity in development is not just an ideal, something that operates in the realm of ideas or aspirations. It is a concept framework that guides decision – making to enhance lives in cities for all; a useful tool needed to redefine the urban policy agenda at local, national and regional levels to ensure shared prosperity; and a factor to enhance the city’s transformative capacity to bring about collective well-being and fulfillment of all.
I’ll leave the last word as to how and why this Ecocitizen World Map can be such a powerful tool to get us there to Kirstin Miller:
As the global community is becoming more aware of the crucial role cities play in mitigating climate change and leading the way toward sustainable development, the importance of understanding and connecting the diverse layers that comprise urban ecosystems cannot be overstated. And in order to make informed decisions that benefit all stakeholders equitably and sustainably we have to delve more deeply into as many social, geographical, and environmental areas as possible. And who better to provide that first-hand knowledge than the inhabitants of those microcosms?




Thank you for giving us an update of your current project. It all seems so overwhelming! Kudos to you for taking on the challenge.
In the meantime, can you please provide a brief description of the kind of person you want to target for filling out the map survey(s)? What are the parameters that constitute an urban setting? A neighborhood resident? In this age of fast reading, I originally began putting my location on the map only to realize my setting is far too rural for the endeavor.
Finally, what are your thoughts for making the City of California a pilot? In light of the recent earthquake activity, Californians must be taking a hard look at their infrastructure, especially as it relates to the wrath of nature. It seems like such an opportune time to shake things up!
Thanks for stopping by, Ruth.
As far as your first question, the general survey is pretty informal, so I wouldn’t worry too much about being “too rural.” It’s more to get an idea of people’s experiences of their neighborhoods and living conditions. There may not be enough people from your area taking the survey to provide a meaningful cluster or sample size, but it might give you a better understanding about which parts of the 15 ecocity conditions are relevant to your area. My guess would be all of them…
http://ecocitizenworldmap.org/report/
The second part I’m not sure whether you mean the State of California or a particular city. I think there are a few cities already interested, we’ll see if any of them come on board. I know that at least in San Francisco we have Neighborhood Emergency Response Team (NERT), a community based training program dedicated to a neighbor-helping-neighbor approach in case of a natural disaster. ( http://www.sf-fire.org/index.aspx?page=859 ) That would be a really good example of a high functioning community participation aspect, which would fall into this condition: http://ecocitizenworldmap.org/report/category/community-and-governance
However, there are also a lot of people in SF who don’t know about NERT and don’t think much about earthquakes, so if you get a big enough sample size the Map could provide information to the fire department as to how many residents aren’t aware of the program. Also, through the interactive part of the map (that’s still being built) those who don’t know what to do in case of an earthquake could learn from their fellow citizens. So that would be a great example of the Map facilitating direct exchanges of information and ideas.
Thanks Sven!
VERY inspiring!!